Scattered workflow工作流分散
Data, jobs, experiments and visual outputs lived across separate tools.数据、任务、实验和可视化结果分散在不同工具中。
A collaborative analysis platform for machine-learning scientists面向机器学习科学家的协作式数据分析平台
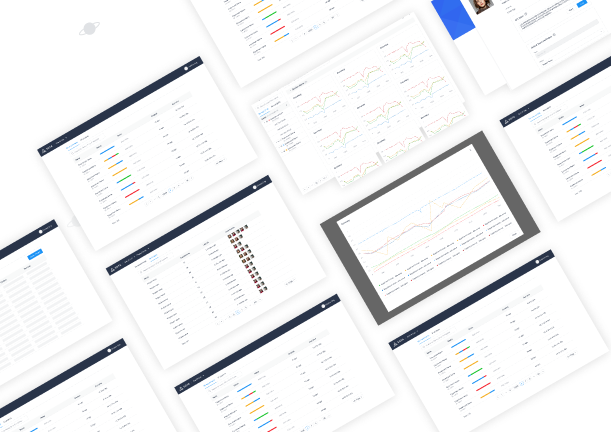
Machine-learning scientists learn from large datasets, build models, compare experiments and continuously revise their work. SOTA gives them one protected environment to visualize model performance, share results and develop better algorithms together.
机器学习科学家需要从海量数据中训练模型、比较实验,并持续修正结果。SOTA 将模型表现可视化、实验管理和团队协作组织在同一个受保护的环境中,让科学家能够共同理解结果并持续优化算法。
Data, jobs, experiments and visual outputs lived across separate tools.数据、任务、实验和可视化结果分散在不同工具中。
Scientists needed flexible plots and tables to understand model differences.科学家需要灵活的图表与表格来理解模型差异。
Screenshots and links could not preserve experiment context or ownership.截图和链接无法完整保留实验上下文与协作关系。
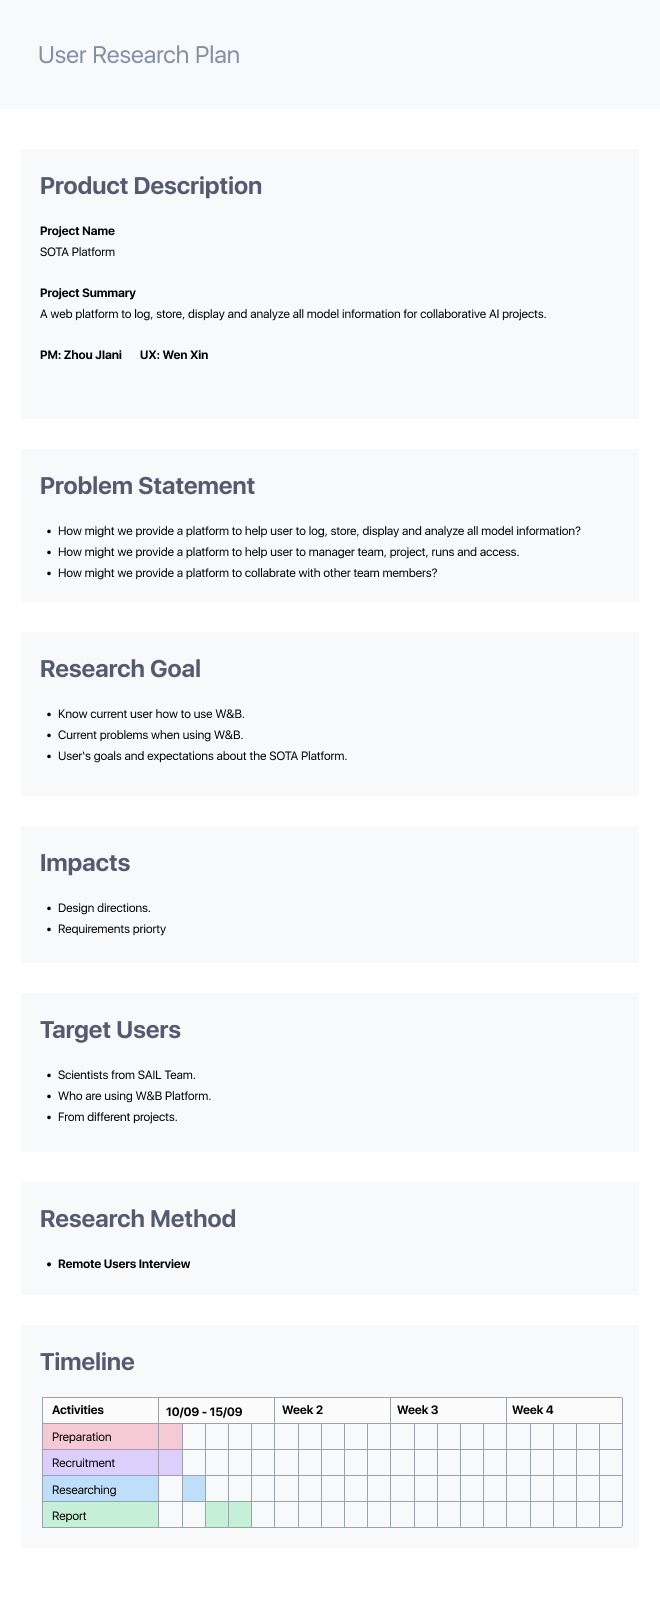
Visualization was only one part of the task. Research focused on how scientists formed questions, logged data, managed teams and projects, compared experiments and shared findings.可视化只是整体任务的一部分。研究首先理解科学家如何提出问题、记录数据、管理团队与项目、比较实验并分享结果。
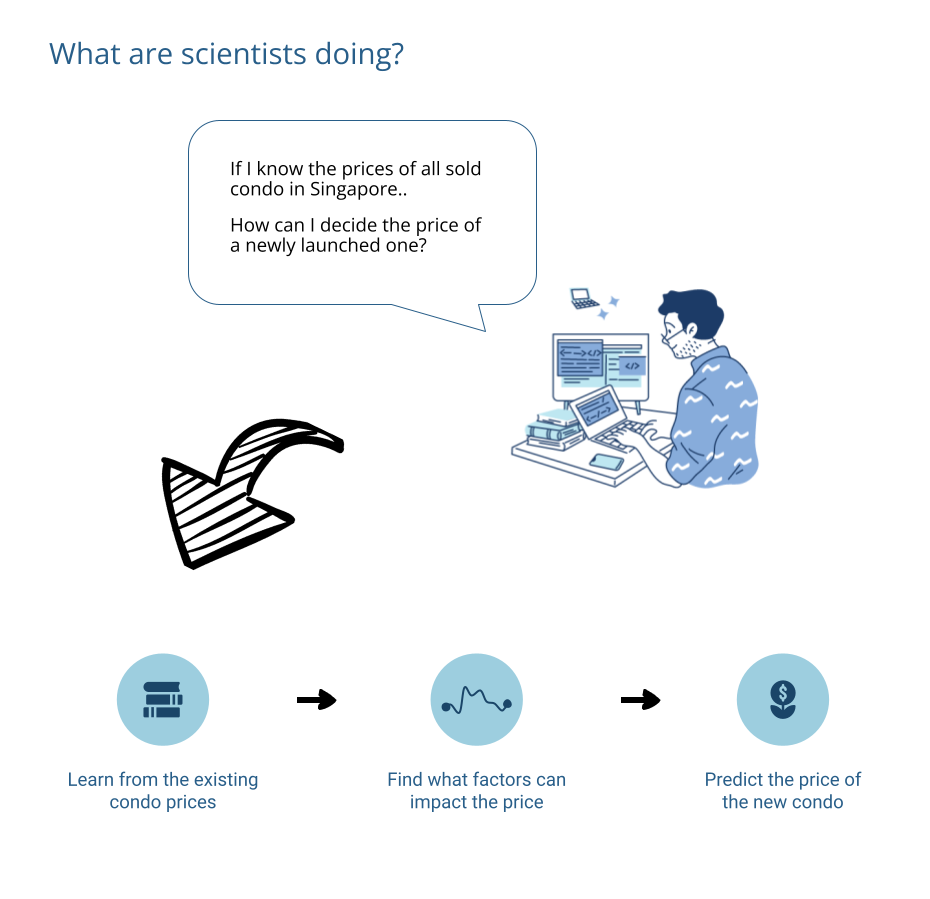
We mapped how a scientist learns from historical data, identifies influential factors and predicts a new outcome. This reframed SOTA from a visualization tool into an end-to-end analysis workspace.我们梳理科学家如何从历史数据中学习、寻找影响因素并预测新结果。这让 SOTA 从单一可视化工具转变为端到端的分析工作台。
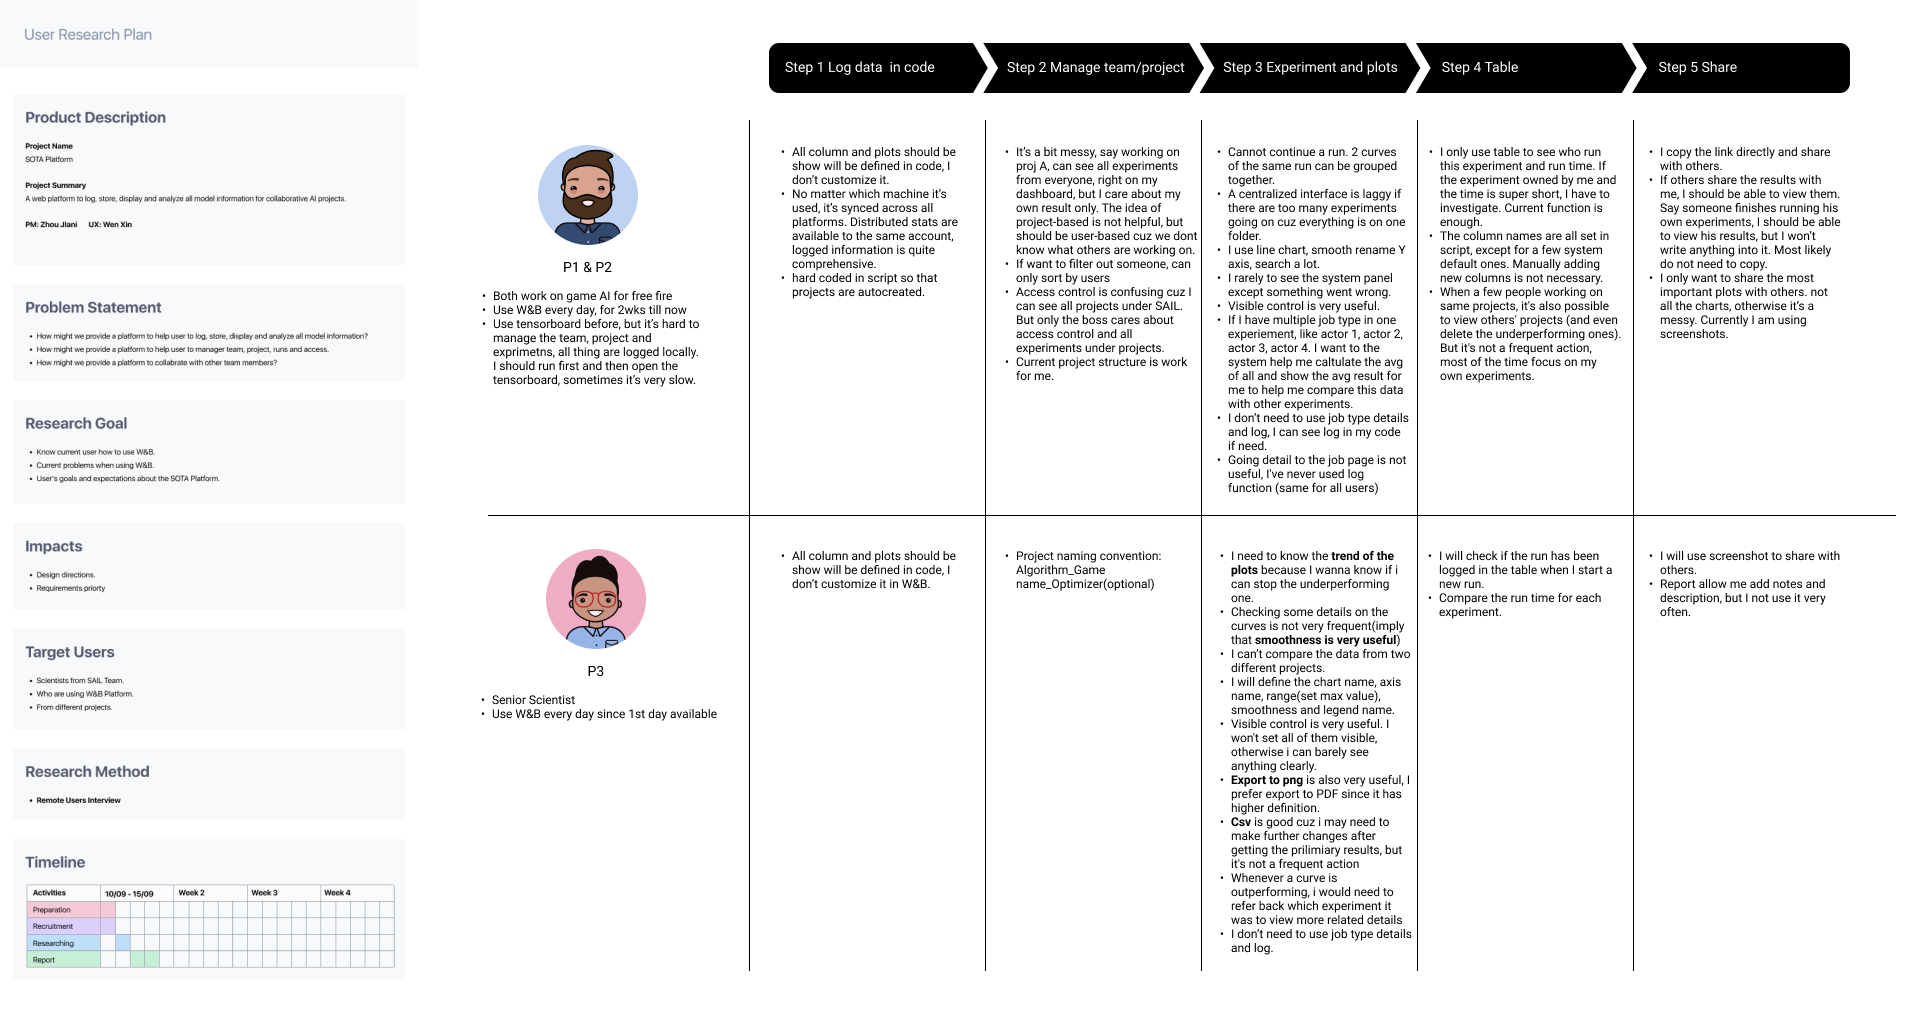
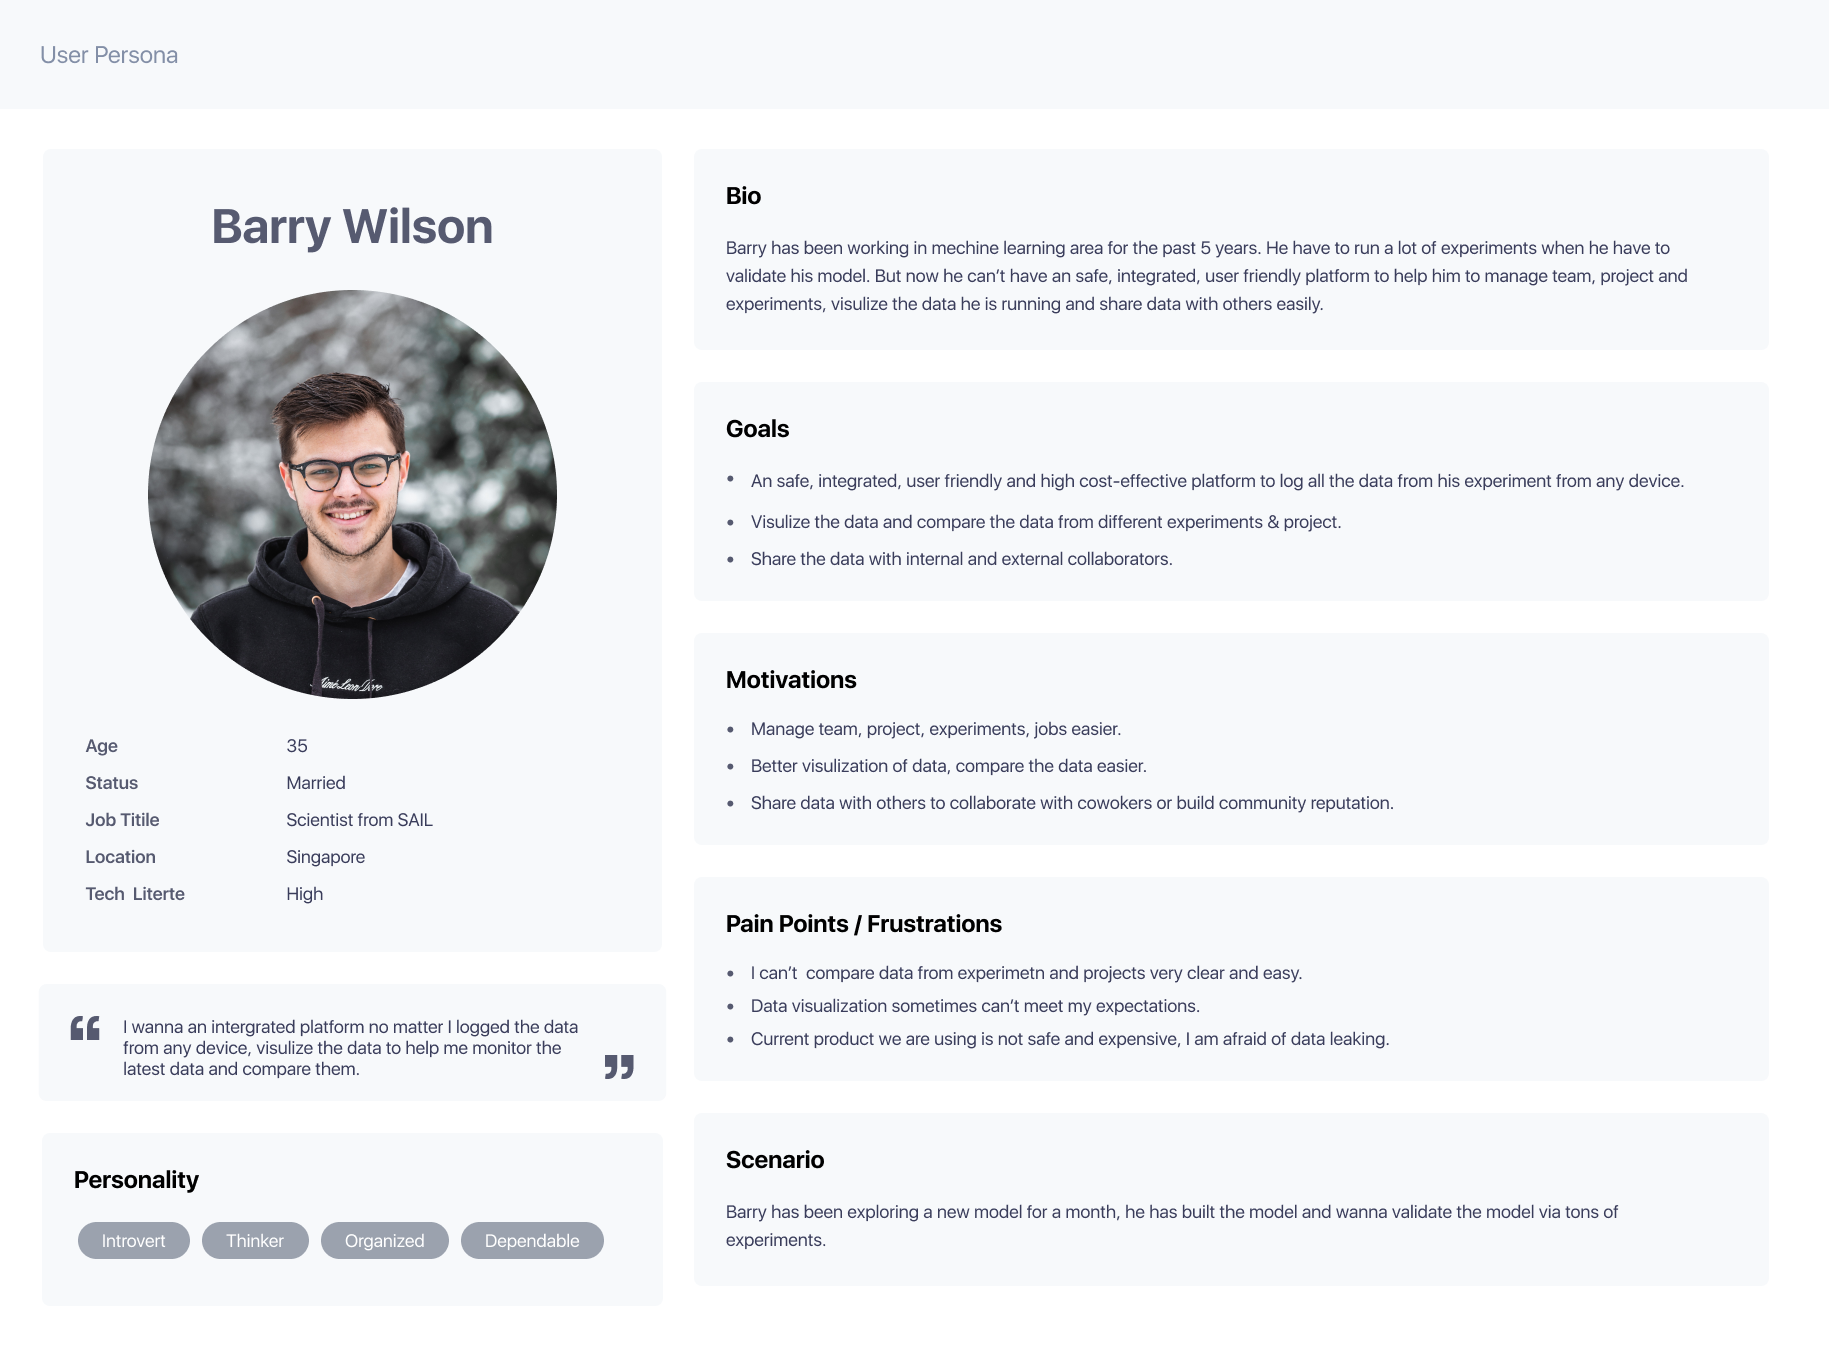
The persona helped the team move beyond individual requests and align around a coherent platform: integrated visualization, flexible comparison and collaboration without losing privacy or ownership.用户角色帮助团队超越零散需求,围绕一个完整平台建立共识:整合可视化、灵活比较,同时保护数据隐私和实验归属。
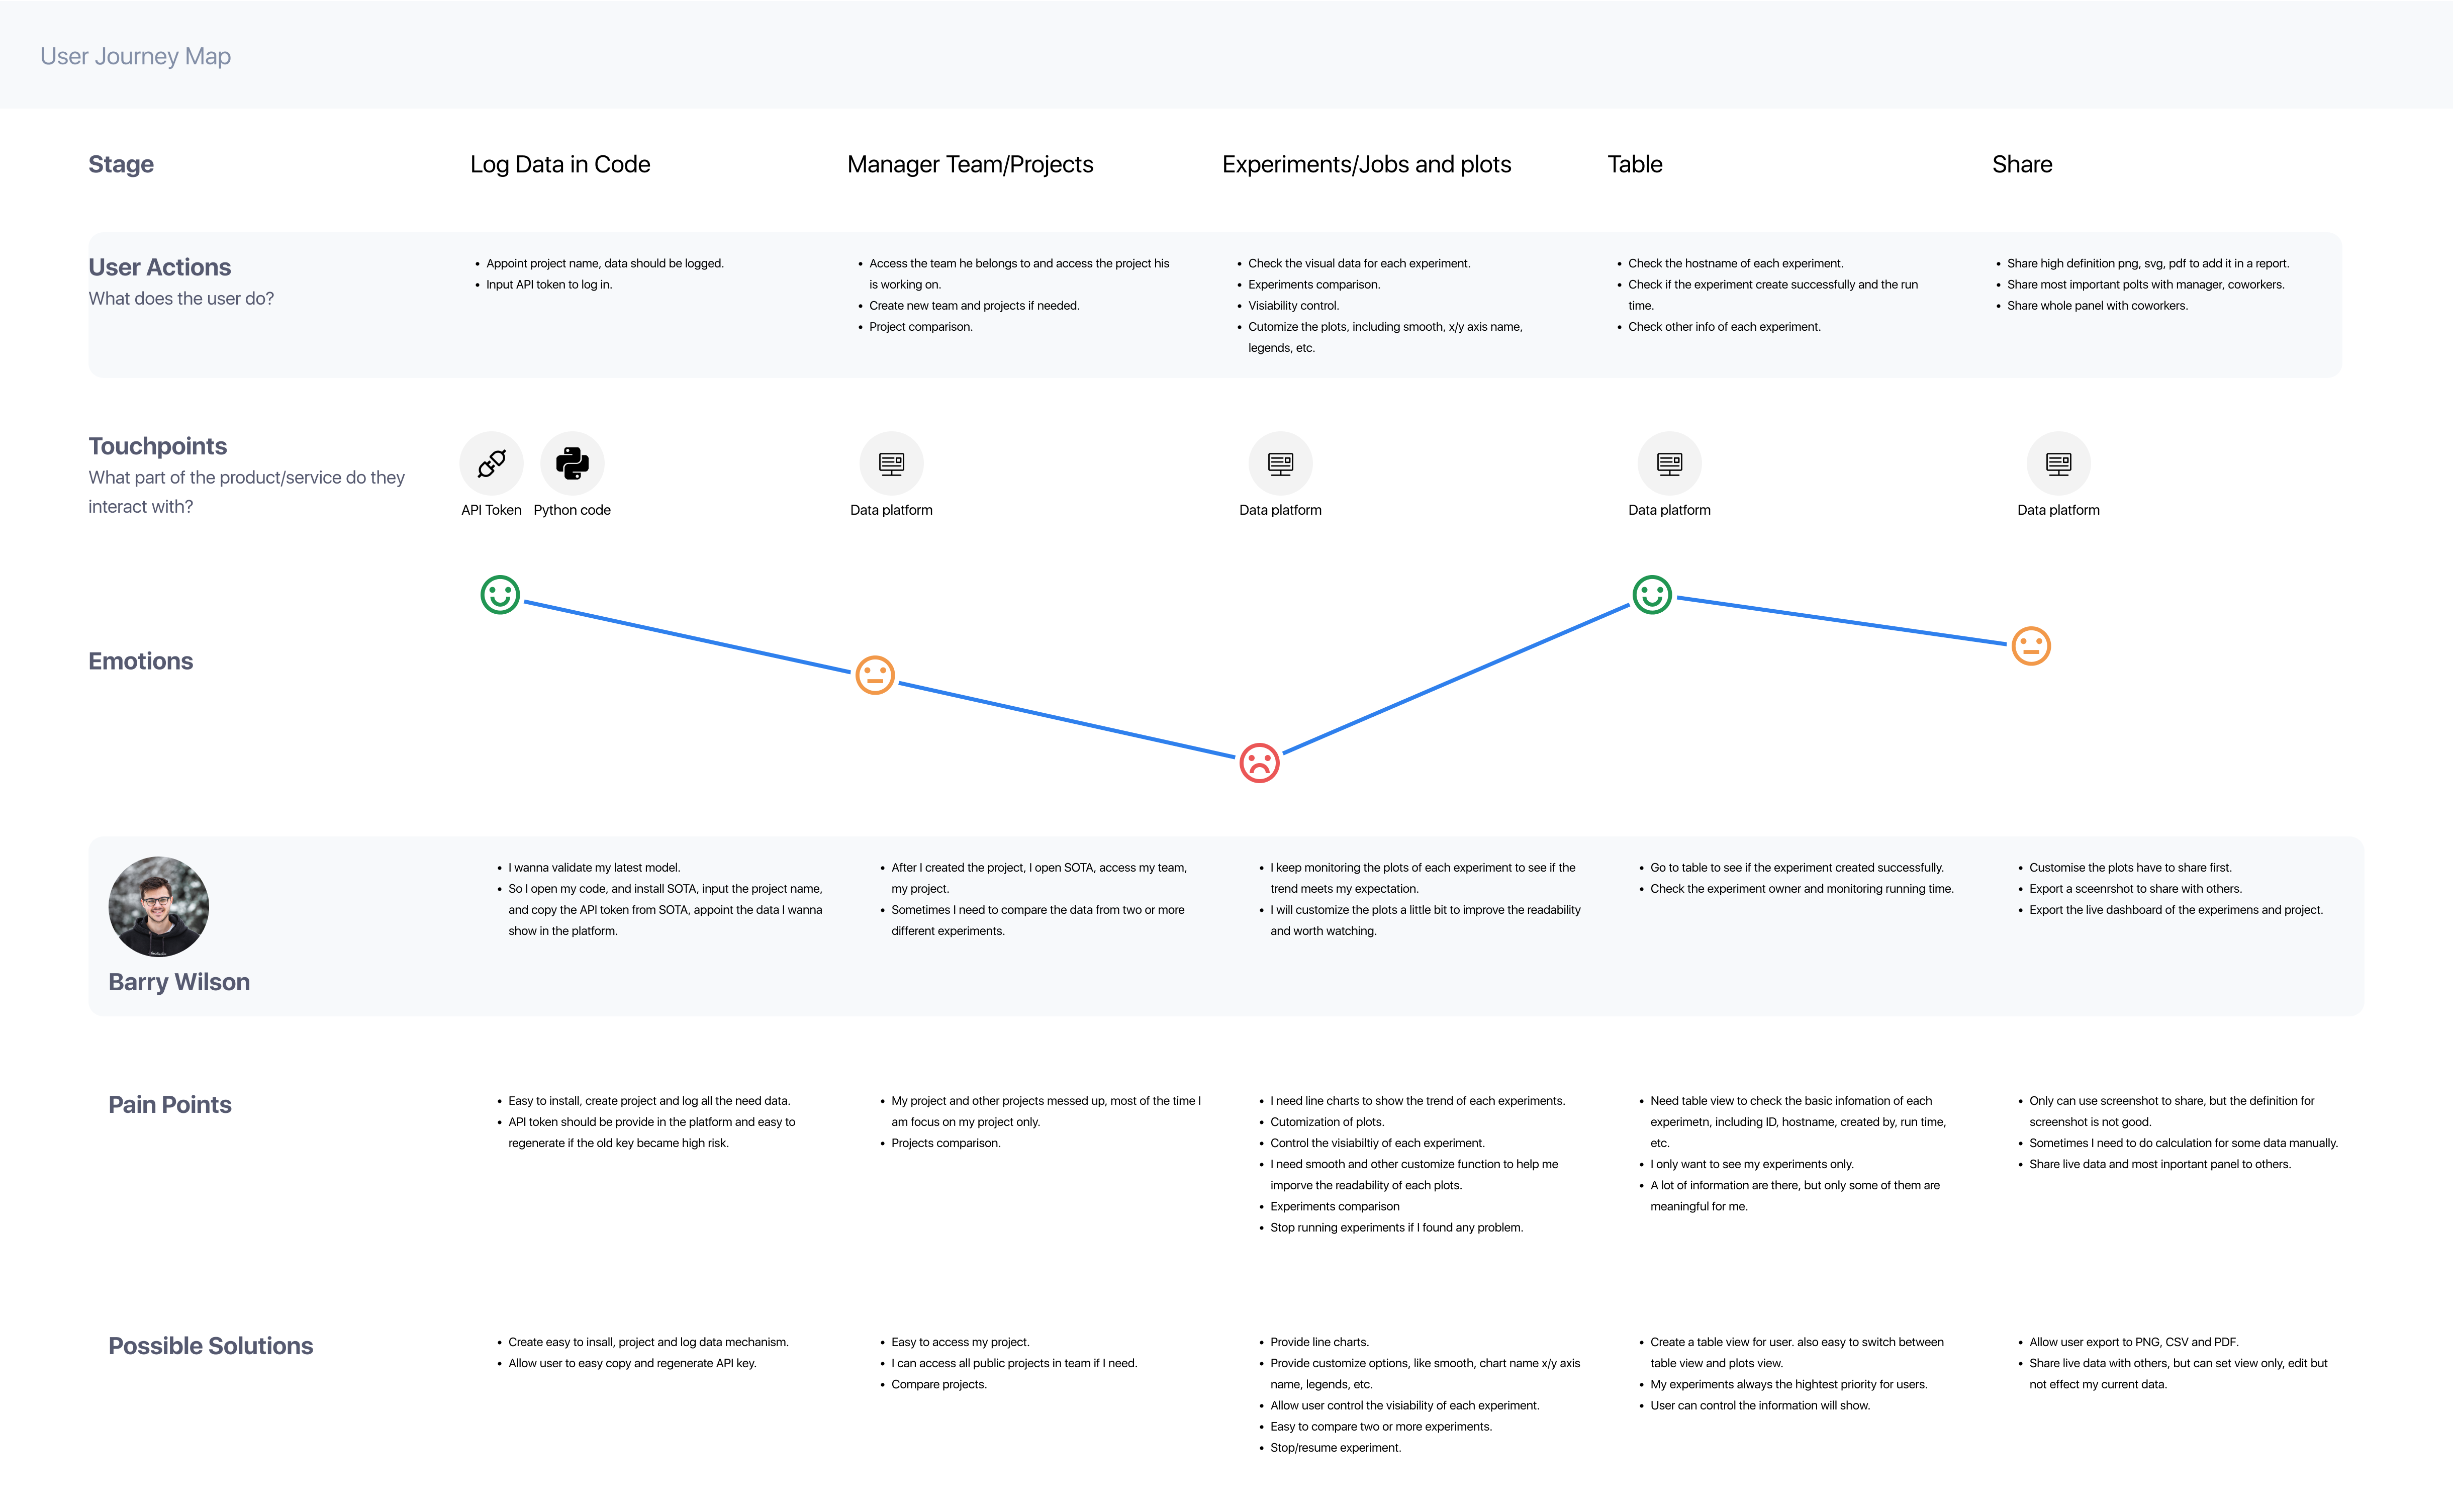
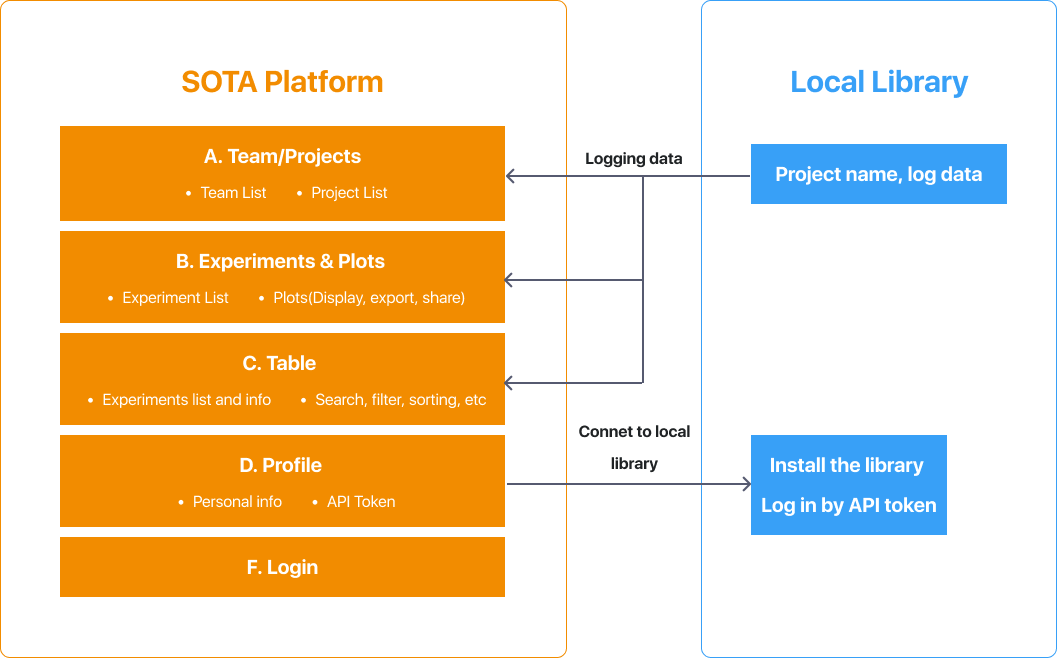
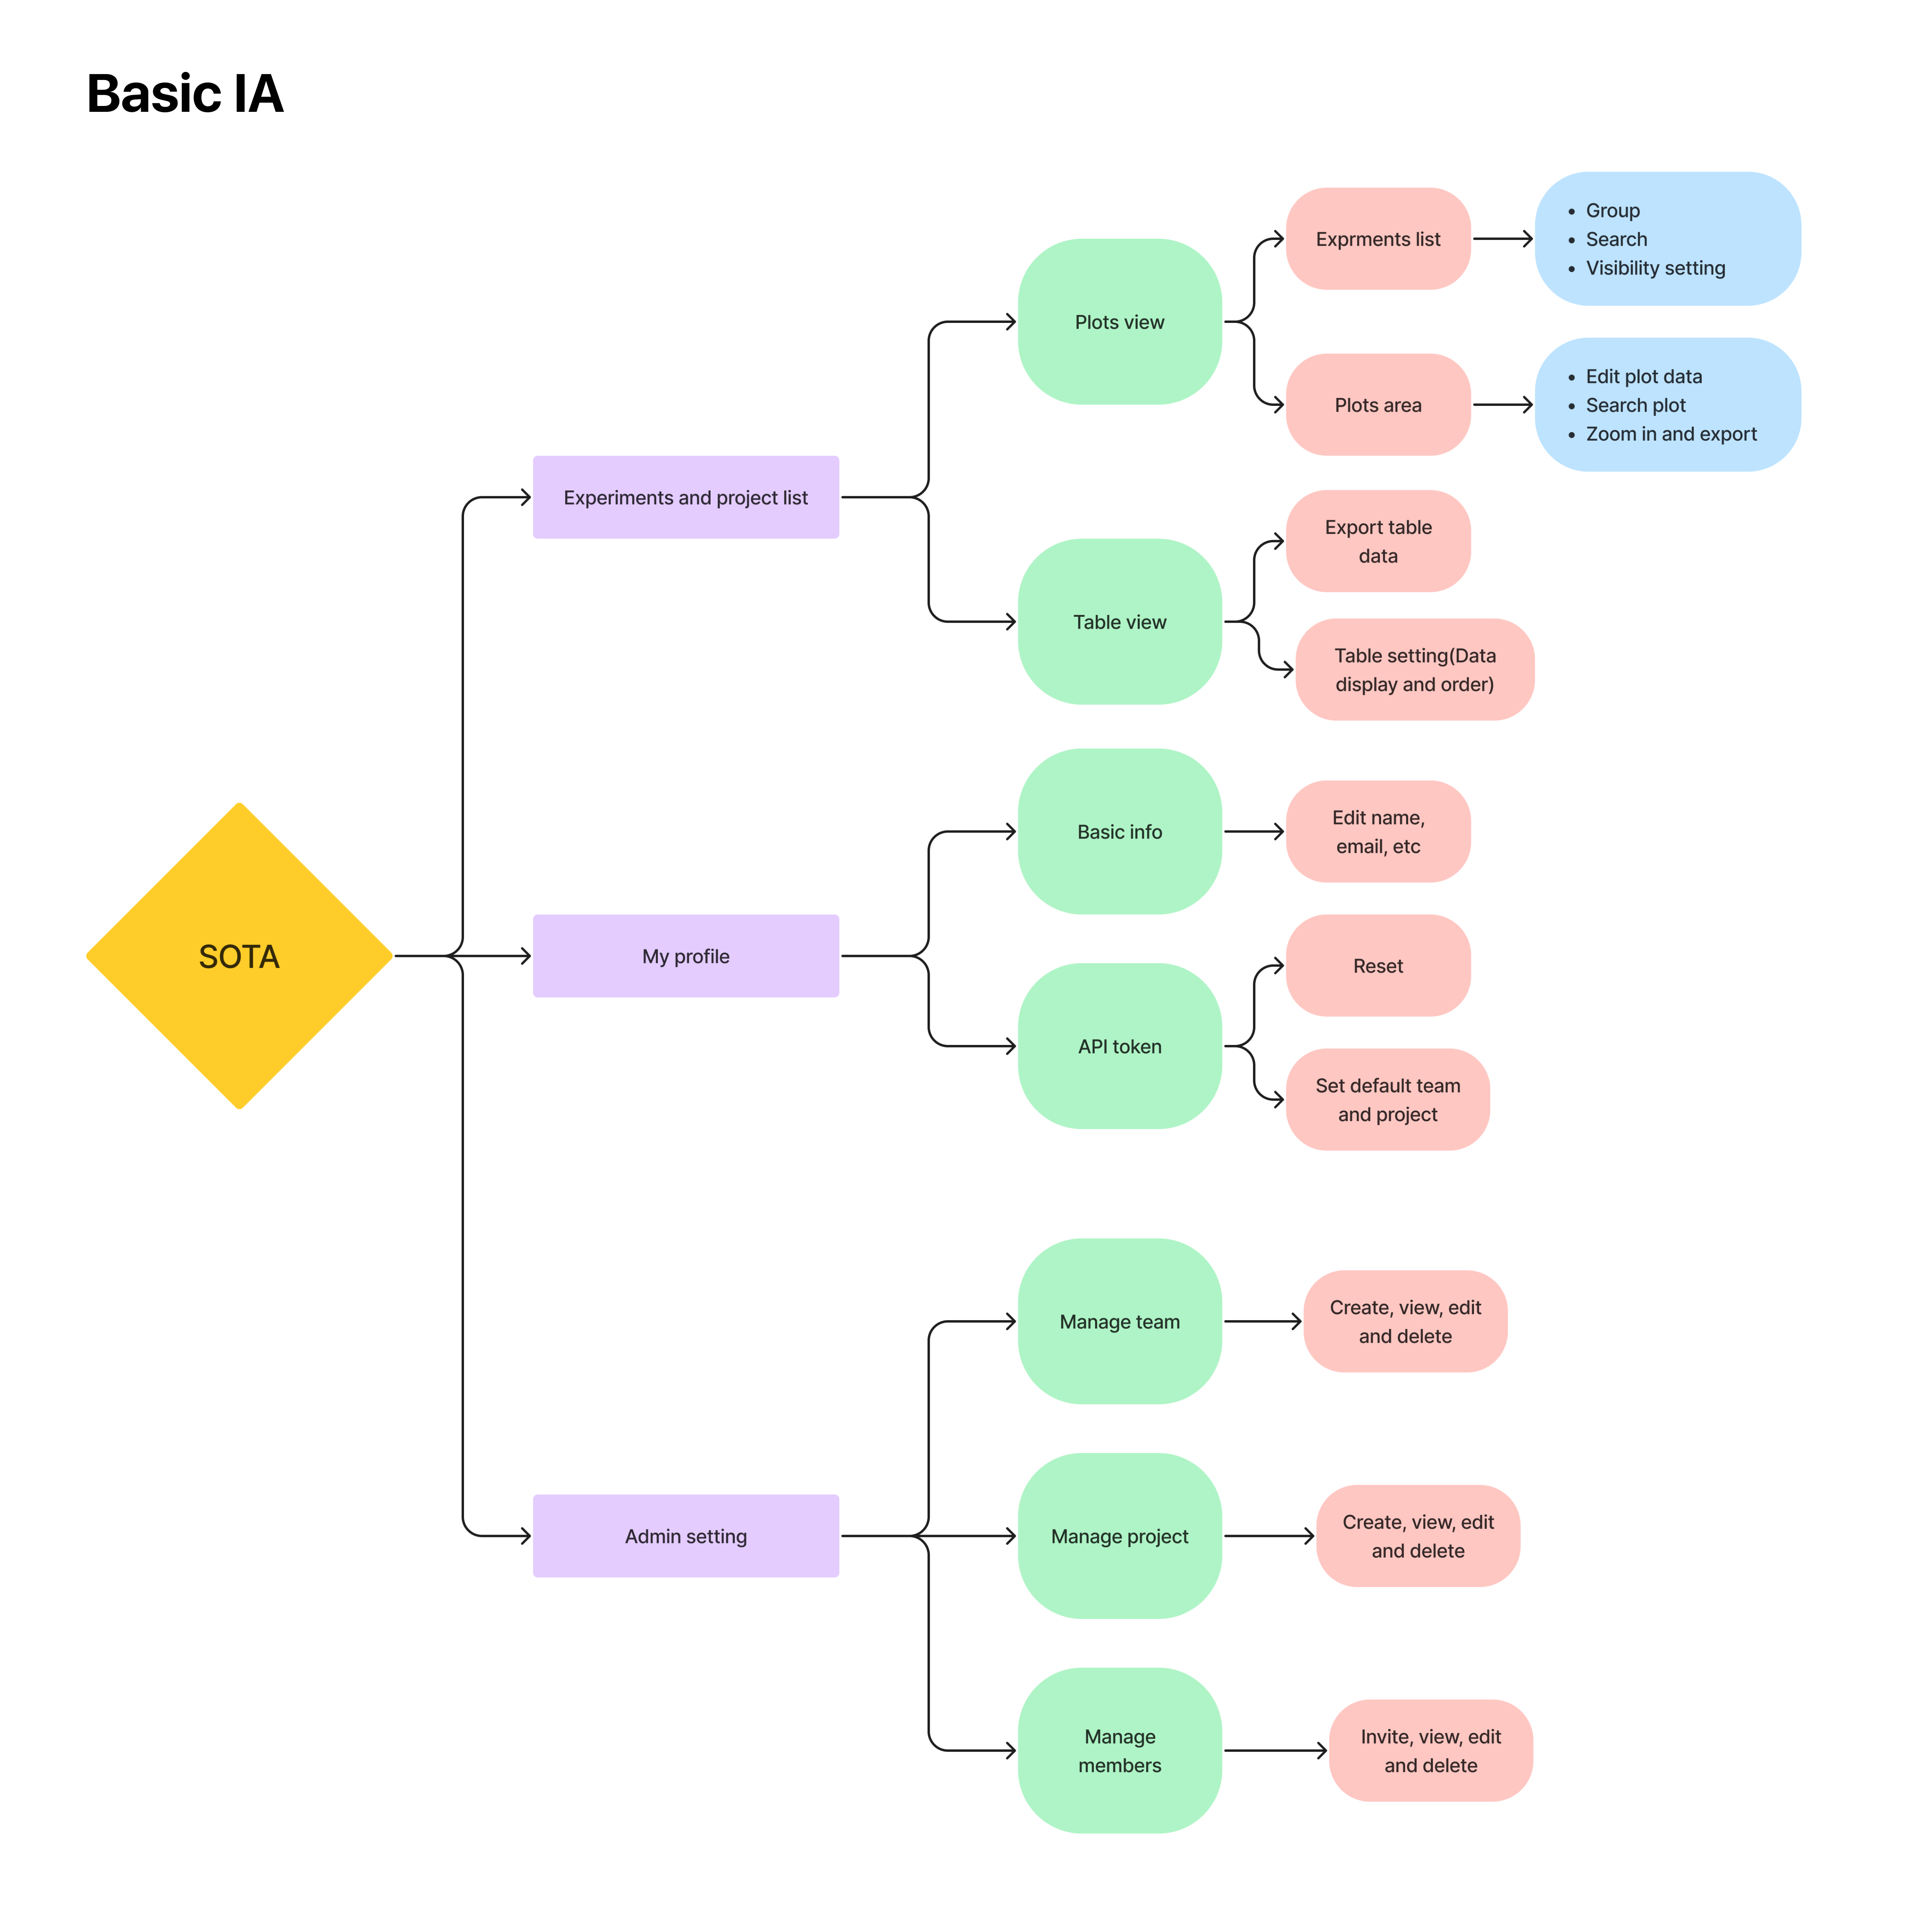
The product architecture connects team management, projects, experiment plots, table views and profiles while preserving a clear route from raw data to shared conclusions.产品架构连接团队管理、项目、实验图表、表格视图和个人资料,并保留从原始数据到共享结论的清晰路径。
Experiments stay connected to teams, projects and owners.实验始终与团队、项目和负责人保持关联。
Plots and tables support different comparison and inspection needs.图表与表格支持不同的比较和检查需求。
Notes, permissions and links preserve the meaning of a result.备注、权限和链接共同保留结果的含义。
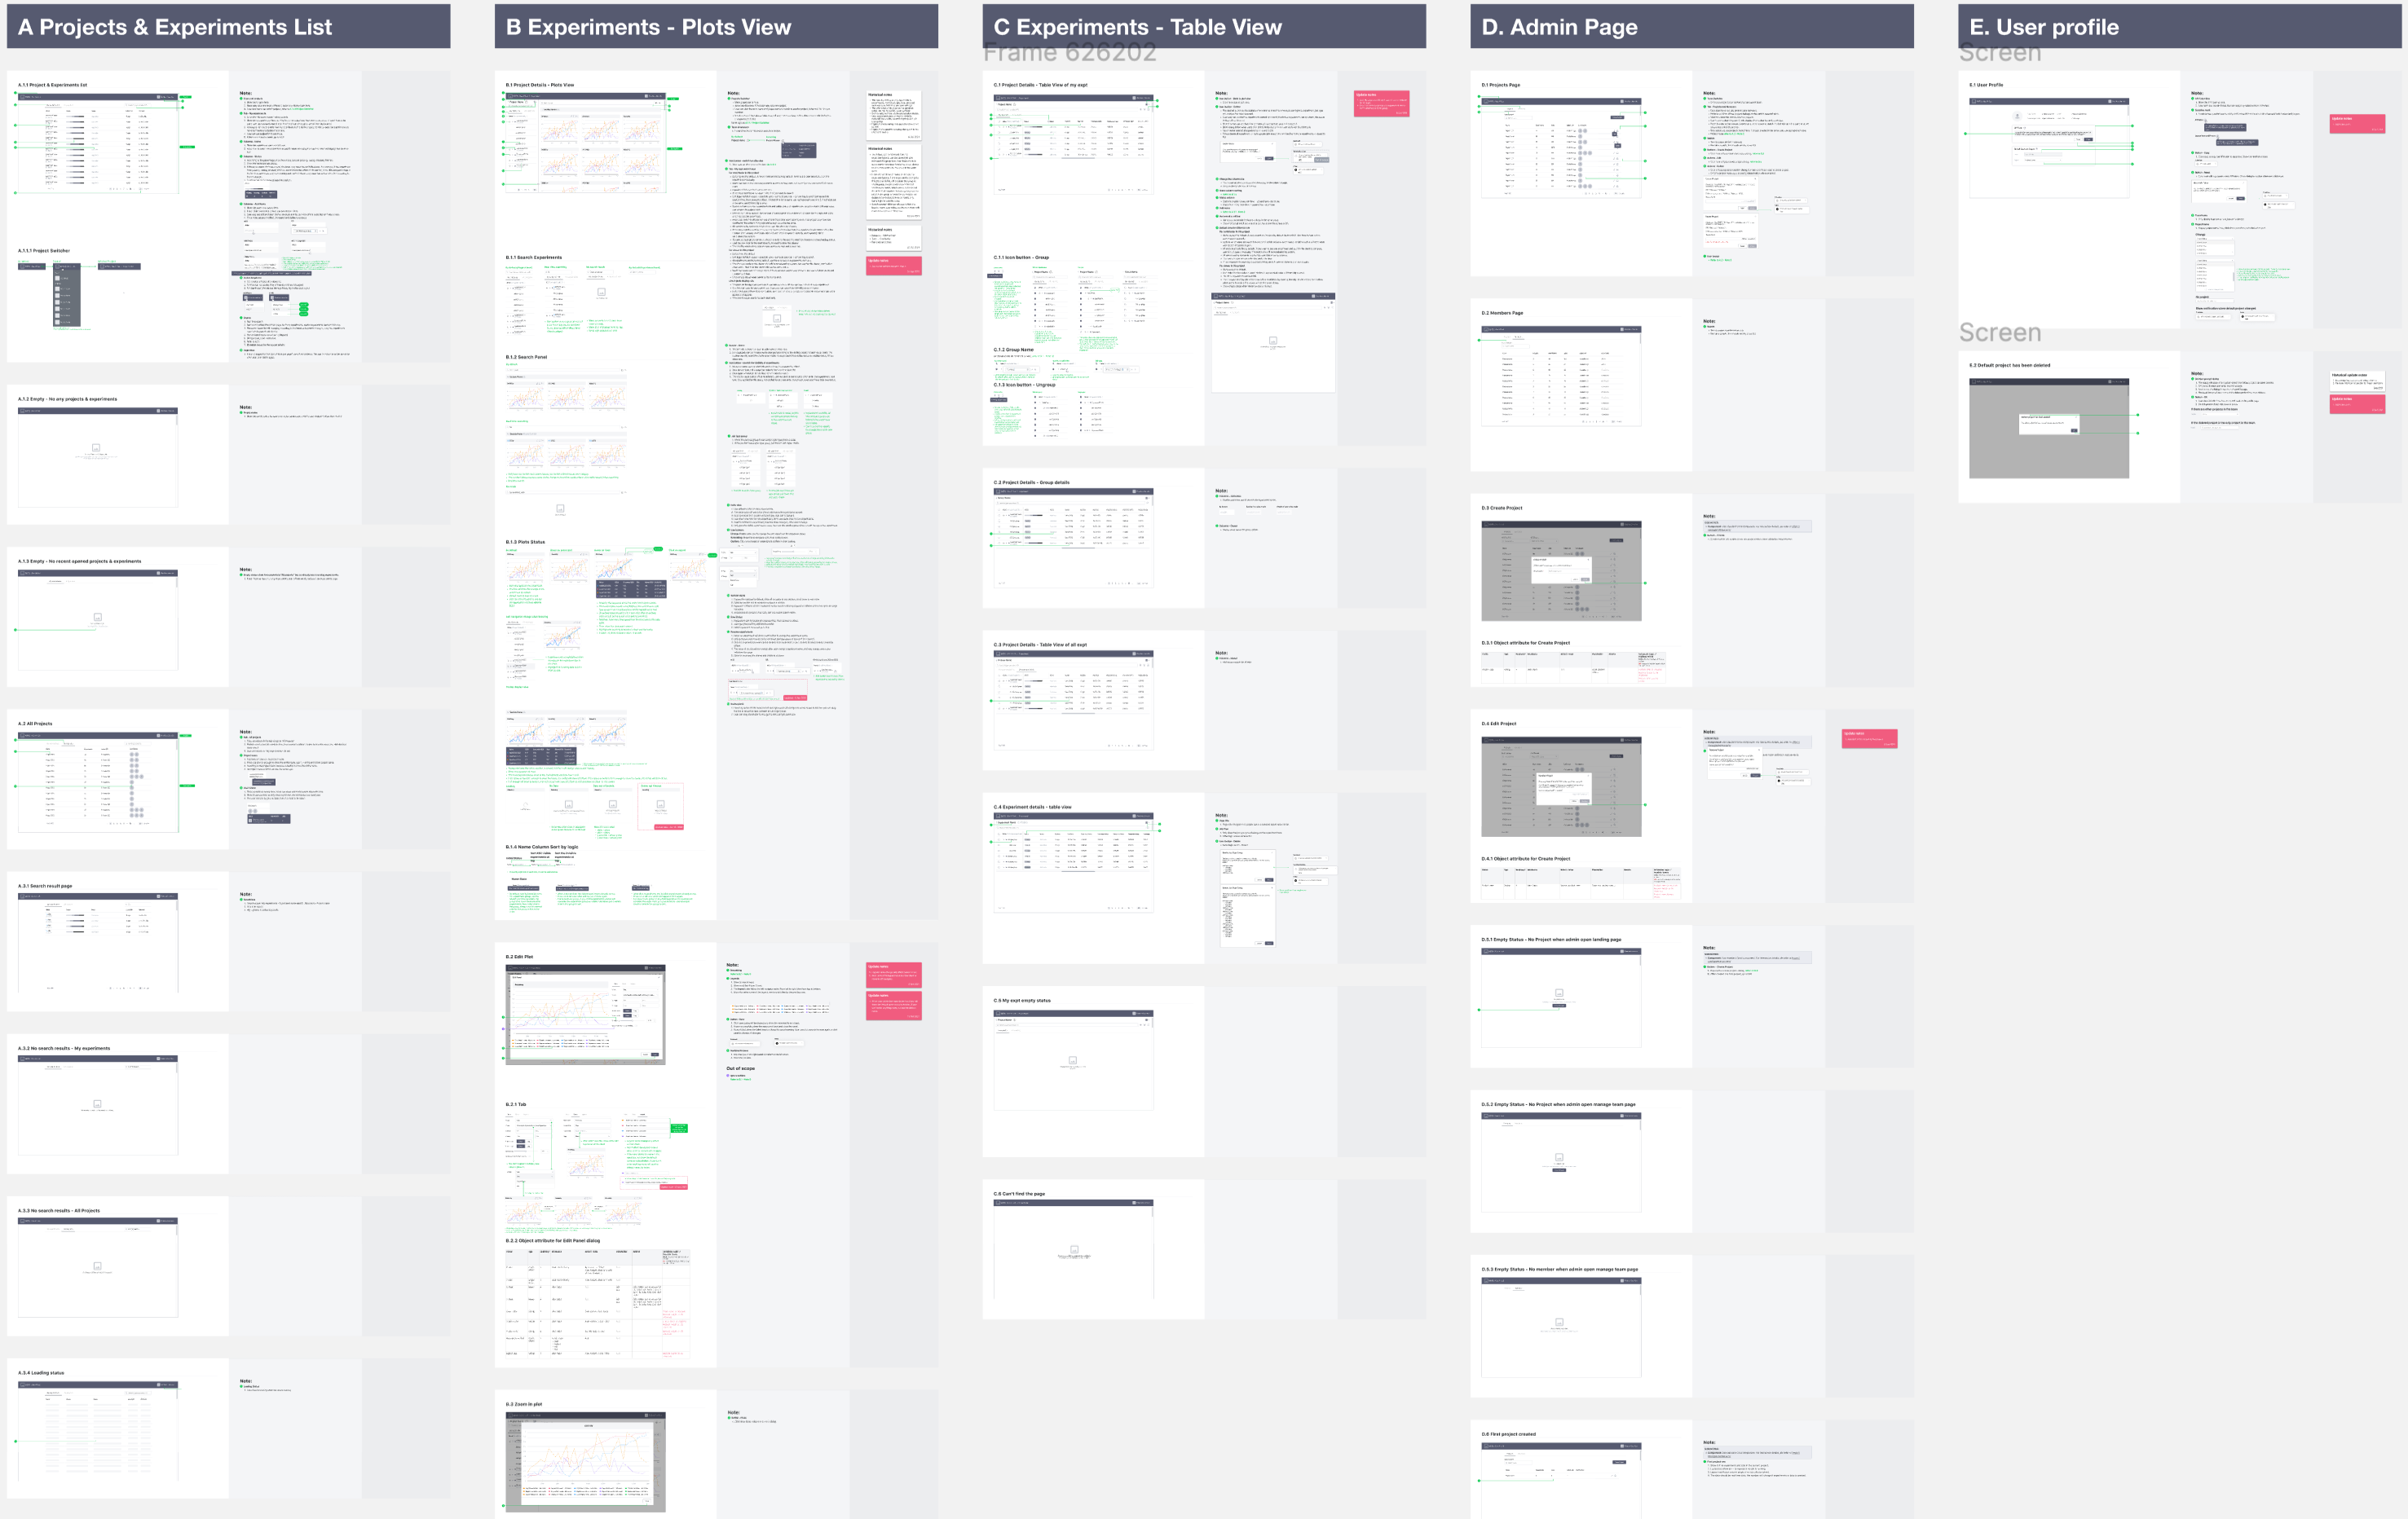
Before moving into final visual design, we returned to users for the first validation round. Testing interaction logic early reduced rework and confirmed that the platform matched scientists' expectations.进入最终视觉设计前,我们先与用户进行第一轮验证。提前测试交互逻辑减少了返工,也确认平台整体符合科学家的工作预期。
The final visual design turns complex experiment data into a restrained workspace with clear project, plot and table views.最终视觉方案将复杂实验数据整理为克制、清晰的工作台,统一项目、图表与表格视图。
SOTA treated iteration as a shared planning activity. User feedback, product value and engineering resources were translated into a roadmap that was specific in the near term and flexible in the long term.SOTA 将迭代视为共同规划的过程。用户反馈、产品价值和工程资源被转化为近期具体、远期灵活的路线图。
Maintain immediate contact with active scientists.与活跃科学家保持即时联系。
Let users record problems and requests when they occur.让用户随时记录遇到的问题和需求。
Invite users into the product iteration lifecycle.让用户参与产品迭代的完整生命周期。
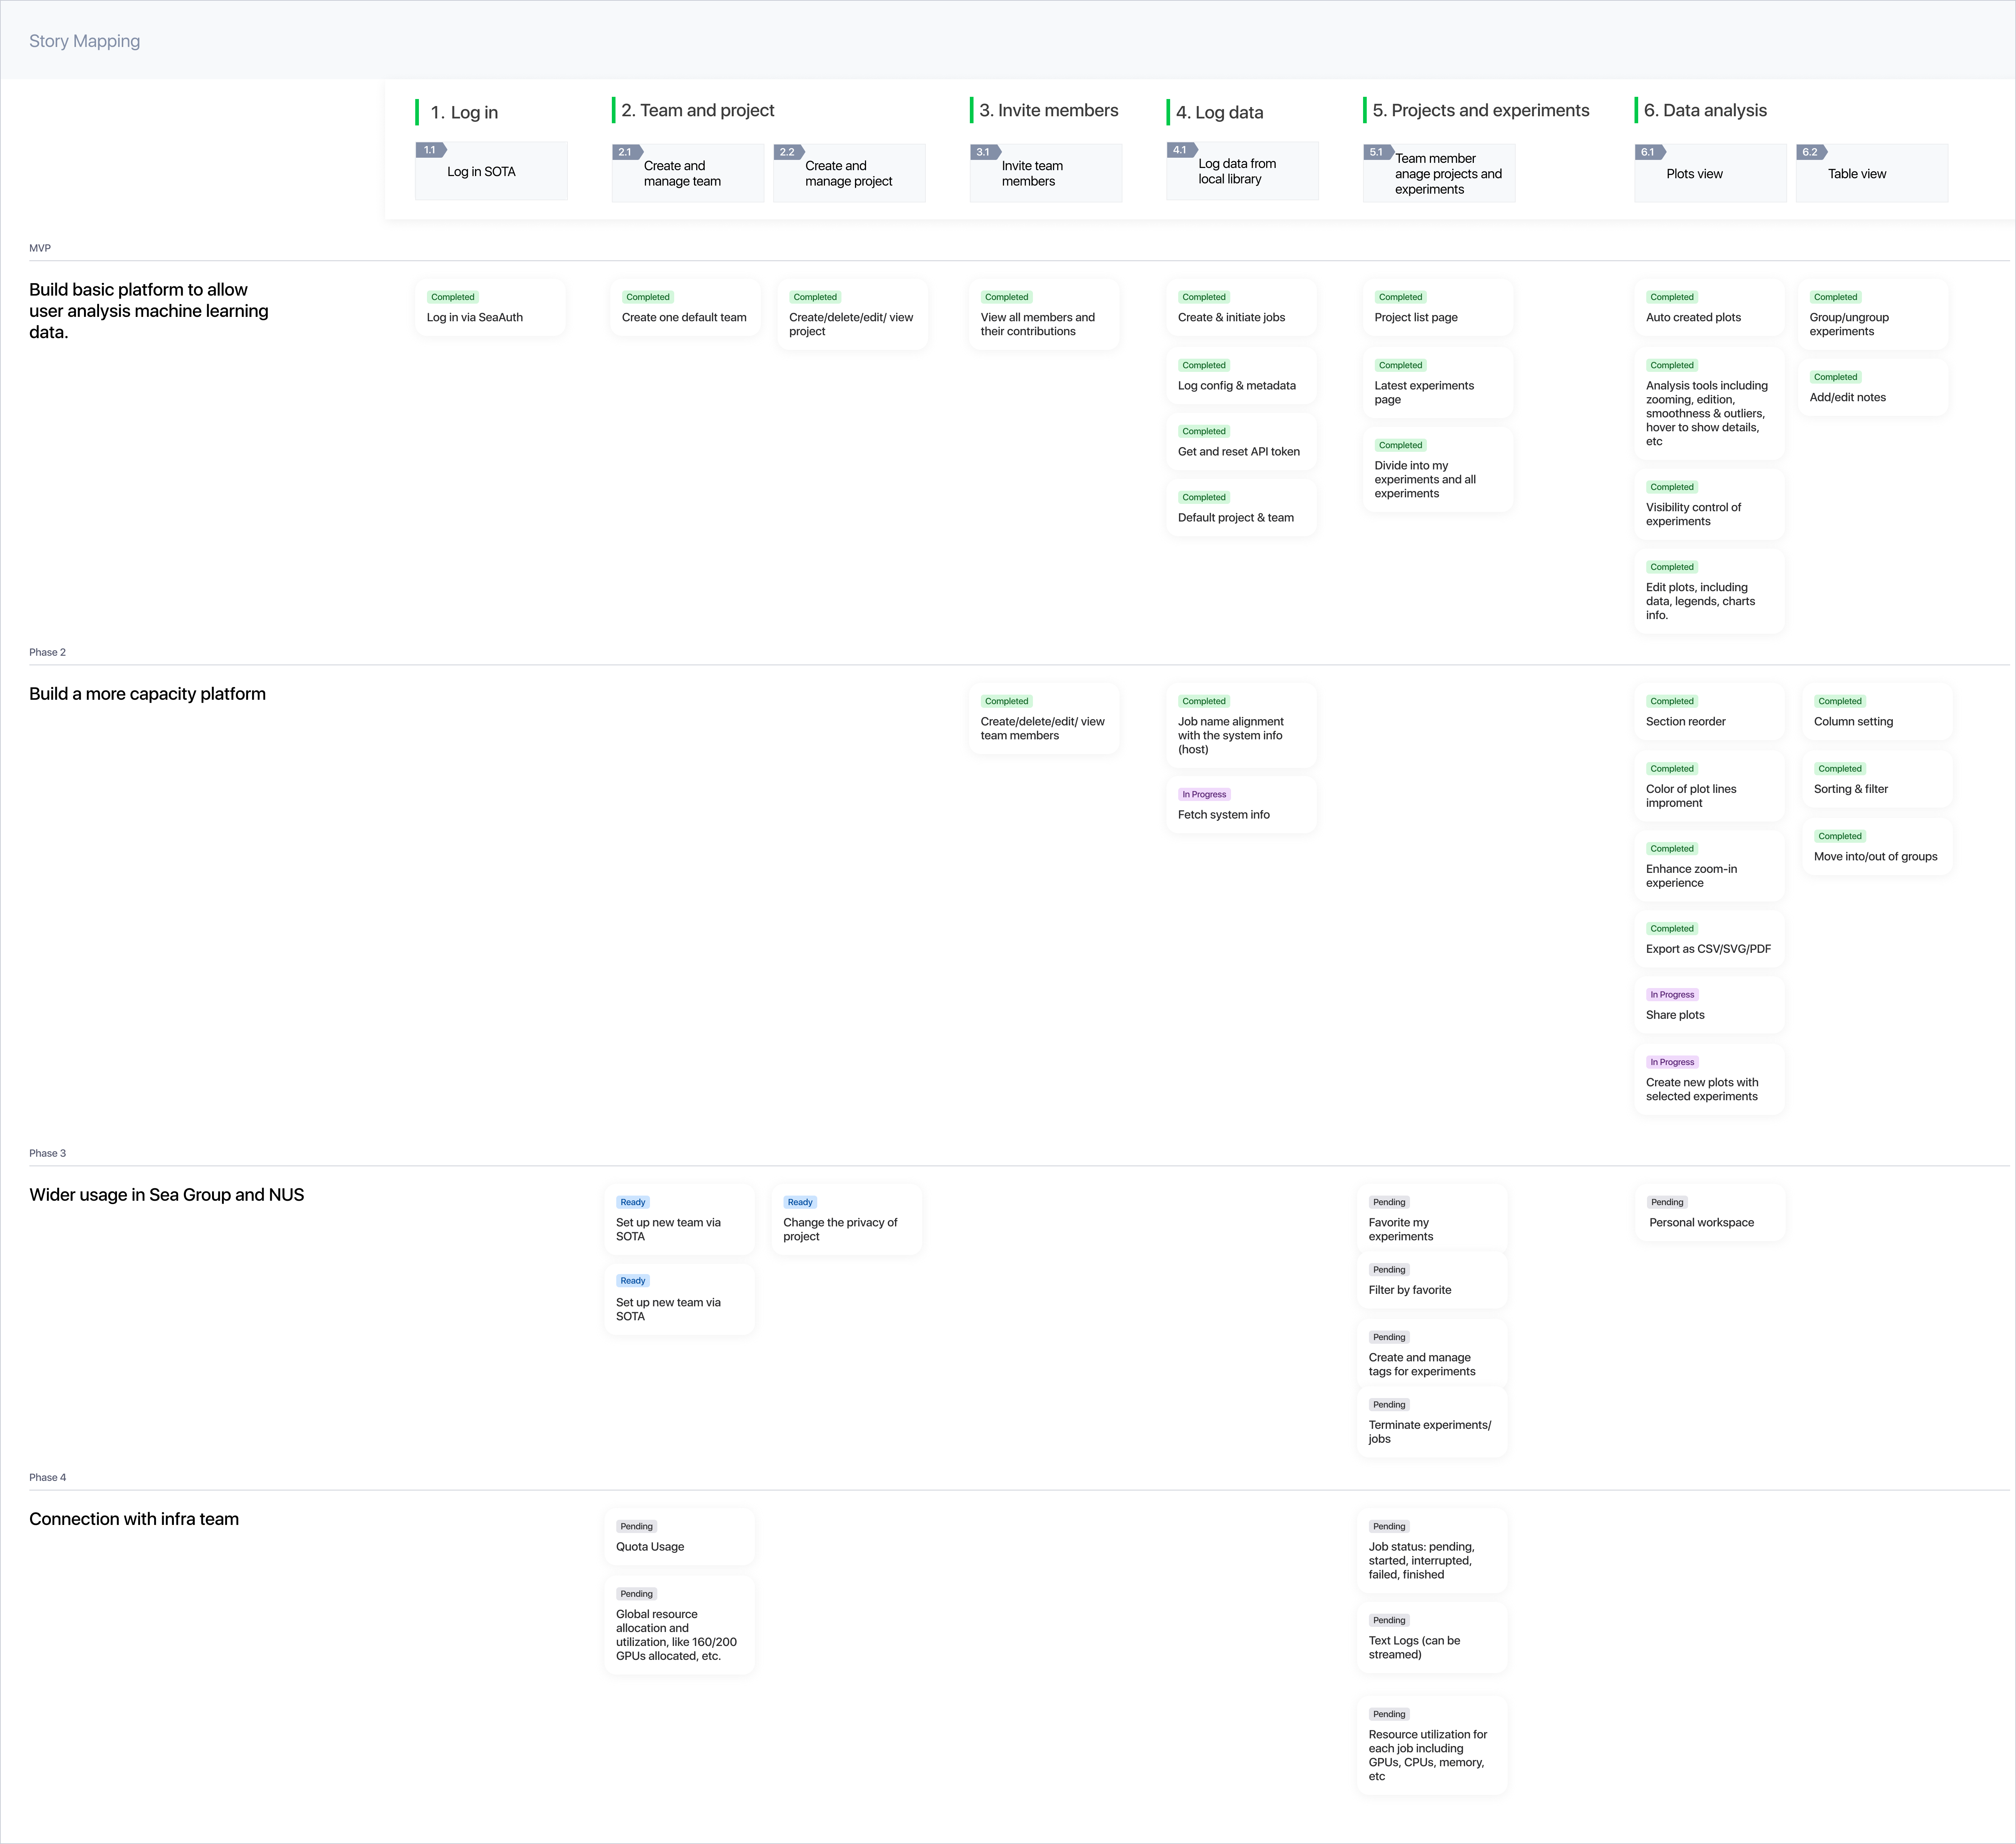
Protected internal model data and experiment results.保护内部模型数据与实验结果。
Made model performance easier to inspect and compare.让模型表现更容易查看与比较。
Connected teams, projects, experiments and shared evidence.连接团队、项目、实验与共享证据。
Created a repeatable feedback and planning loop.建立可持续的反馈与规划闭环。
The right dashboard does not begin with charts. It begins with the decisions people need to make together.真正有效的数据平台,不是从图表开始,而是从团队需要共同做出的判断开始。
SOTA taught me to treat visualization as part of a larger system of workflow, collaboration and trust.SOTA 让我认识到:可视化必须被放进工作流、协作和信任共同构成的系统中设计。